Inflation Since October 2024 Adds About $4,720 a Year to Household Costs
The October CPI has no 12-month rate because of the 2025 shutdown. Measured from October 2024, prices rose 6.9%, about $4,720 a year more for the average U.S. household, a Daybreak Wire calculation from BLS data shows.
Consumer prices rose 0.4% in October, the U.S. Bureau of Labor Statistics reported on Nov. 10, but the agency could not say how much they rose over the past year.
The gap traces back to the 2025 government shutdown. "BLS did not collect survey data for October 2025 because of a lapse in appropriations," the agency said in its October Consumer Price Index release. "As a result, BLS cannot publish 12-month percent changes for October 2026 for indexes where October 2025 data are unavailable."
Measured over two years instead, prices for urban consumers were 6.9% higher than in October 2024, a Daybreak Wire calculation from the official BLS index levels shows. For the average U.S. household, that means paying about $4,720 more a year, or about $393 a month, for the same goods and services it bought in 2025.
The calculation uses the all-items index BLS published for October 2026, 337.511, and for October 2024, 315.664, to re-price what households spent in 2025, according to the BLS Consumer Expenditure Survey, at both dates.
Spread evenly, that is 3.4% a year, close to the last annual rate BLS was able to publish: 3.7%, for September 2026.
Heather Long, chief economist at Navy Federal Credit Union, estimated a higher figure on her own: the "implied rate is around 4%, well above wage gains of 3.1% in the past year," she said, according to Fox Business. BLS has published no such rate.
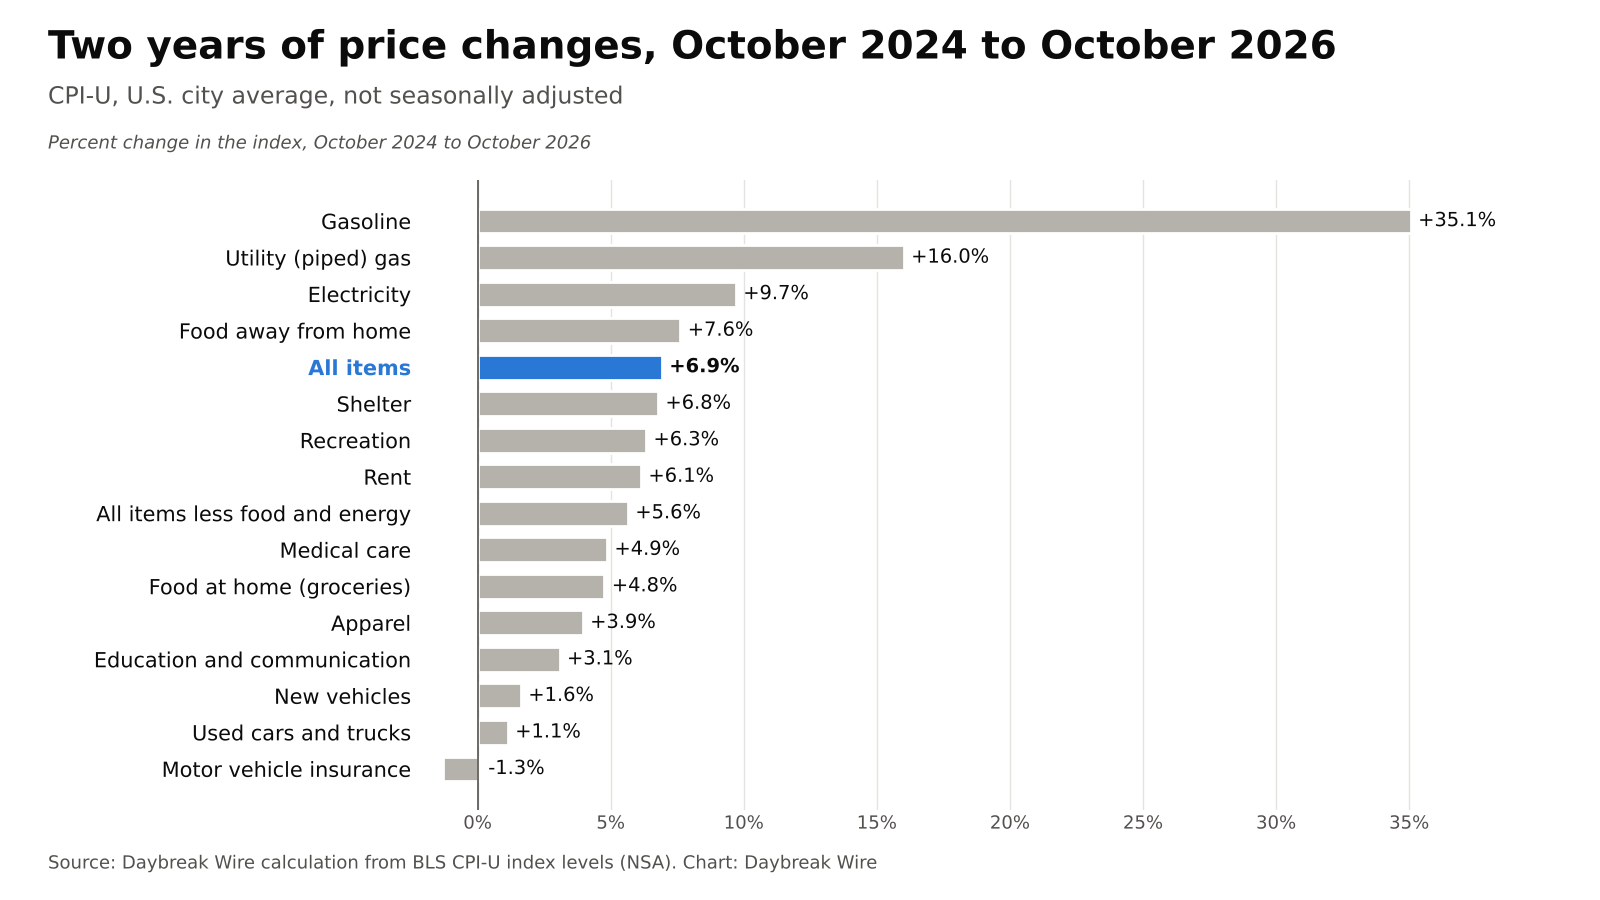
Of the categories in the table, gasoline moved the most, rising 35.1% from October 2024 to October 2026, according to the Daybreak Wire calculation. Home energy came next in the table, with piped utility gas and electricity both rising faster than prices overall.
Fuel oil, a small part of most household budgets, rose faster still, by about 90% over the two years, the same calculation from BLS index levels shows.
Car insurance went the other way: the motor vehicle insurance index finished slightly below its October 2024 level.
The table compares each category's two-year change with its change in the year to September 2026, computed from the same BLS indexes.
| Category (CPI-U) | Oct 2024 to Oct 2026 | Per year, compounded | 12 months to Sept 2026 |
|---|---|---|---|
| All items | +6.9% | +3.4% | +3.7% |
| All items less food and energy (core) | +5.6% | +2.8% | +2.6% |
| Gasoline (all types) | +35.1% | +16.2% | +34.2% |
| Utility (piped) gas service | +16.0% | +7.7% | +5.0% |
| Electricity | +9.7% | +4.7% | +4.4% |
| Food away from home | +7.6% | +3.7% | +3.5% |
| Shelter | +6.8% | +3.3% | +3.2% |
| Rent of primary residence | +6.1% | +3.0% | +2.8% |
| Medical care | +4.9% | +2.4% | +1.5% |
| Food at home (groceries) | +4.8% | +2.4% | +1.8% |
| Apparel | +3.9% | +2.0% | +3.4% |
| New vehicles | +1.6% | +0.8% | +0.6% |
| Used cars and trucks | +1.1% | +0.6% | -1.5% |
| Motor vehicle insurance | -1.3% | -0.7% | -5.0% |
Source: Daybreak Wire calculation from BLS CPI-U index levels, U.S. city average, not seasonally adjusted.
Gasoline is one of three series in the table for which BLS did publish an October 2026 annual change, because it has an October 2025 index; the others are new vehicles and used cars and trucks.
The published gasoline figure, a 37.4% annual rise, is larger than the two-year rise because the October 2025 gasoline index sat below the October 2024 one, the BLS data show. Daybreak Wire has tracked how far oil prices have reached the pump.
What everyday bills cost now
Seven everyday bills (groceries, restaurant meals, rent, electricity, natural gas, gasoline and car insurance) cost the average household about $2,110 more a year at October 2026 prices than at October 2024 prices, the Daybreak Wire calculation shows.
That extra equals 8.9% of what households spent on those seven bills in 2025, according to the BLS survey.
| Bill | Average 2025 spending | Extra a year | Extra a month |
|---|---|---|---|
| Gasoline and other fuels (CPI motor fuel index, +36.0%) | $2,503 | +$910 | +$76 |
| Rent (averaged over all households) | $6,063 | +$364 | +$30 |
| Restaurant meals | $4,142 | +$307 | +$26 |
| Groceries | $6,491 | +$304 | +$25 |
| Electricity | $1,886 | +$176 | +$15 |
| Natural gas | $562 | +$80 | +$7 |
| Vehicle insurance | $2,153 | -$27 | -$2 |
| Seven everyday bills | $23,800 | +$2,114 | +$176 |
Source: Daybreak Wire calculation; spending from the BLS Consumer Expenditure Survey 2025, all consumer units; prices from BLS CPI-U, October 2024 and October 2026. The fuel line is priced with the CPI motor fuel index rather than the gasoline index alone.
Fuel adds the most of any bill, even though households spend less on it than on groceries or rent.
The rent line is an average across all households, and homeowners count as paying no rent, so a family that rents pays more than that figure suggests.
Across the whole budget, the extra $4,720 a year equals 4.3% of the average household's 2025 pre-tax income as reported in the BLS Consumer Expenditures 2025 release, the Daybreak Wire calculation shows. Daybreak Wire has also compared this year's cost-of-living adjustments for Social Security, federal retirees and veterans.
The Fed weighs a rate hike
The month-to-month numbers were firm too. Prices excluding food and energy rose 0.3% in October, as they did in September and August, BLS said.
"Today's CPI report suggests underlying inflation remains more persistent than the Fed would like," Andrew Davis, head of investment strategy at Bryn Mawr Trust, said in an email reported by CBS News.
"Grocery prices jumped with the biggest monthly gain since April, and electricity saw another big gain," Long said, according to Fox Business.
Fed Governor Christopher Waller had already said in London on Nov. 10, before the release, that he would support at least a quarter-point increase at the Federal Reserve's Dec. 8-9 meeting, Reuters reported.
If core prices rose 0.3% or more, Waller said, "a stronger policy move may be needed." Core prices met that mark, according to BLS.
"Hiking only 25 basis points would put our credibility at risk, a risk I am not eager to take," Waller said, as quoted by CBS News.
James McCann, senior economist for investment strategy at Edward Jones, said the report "most likely seals the deal on a rate hike to close the year," CBS reported.
BLS has scheduled the November 2026 CPI for Thursday, Dec. 10, at 8:30 a.m. ET. The agency has not said whether that release will include annual changes.
BLS did publish November 2025 indexes for most series, which would allow a year-over-year comparison for those series; motor vehicle insurance has no November 2025 index, according to the agency's shutdown FAQ.
David Enna, who writes the Tipswatch blog, wrote that "November 2025 data were highly suspect." BLS itself said that the method it used to fill the October 2025 gap, carrying prices forward, "may result in an underestimation" when prices are rising generally.
Method: Daybreak Wire compared the not-seasonally-adjusted CPI-U index levels BLS published for October 2024 and October 2026; the changes are our calculations, not BLS statistics. Dollar figures re-price the 2025 average household basket from the BLS Consumer Expenditure Survey at both dates. This assumes households buy the same things in the same amounts, and survey figures are averages, not medians.
The household total uses average spending on goods and services, leaving out personal insurance, Social Security and pension contributions, and cash gifts, which are not consumer prices. Homeowners' costs, health insurance premiums, education and car purchases are left out of the everyday bills because the survey and the CPI measure them differently.
Sources
- U.S. Bureau of Labor Statistics, Consumer Price Index, October 2026 (Nov. 10, 2026)
- U.S. Bureau of Labor Statistics, Notice on 12-month changes for October 2026
- U.S. Bureau of Labor Statistics, 2025 federal government shutdown impact on the CPI: FAQ
- U.S. Bureau of Labor Statistics, 2025 lapse in appropriations: revised release dates
- U.S. Bureau of Labor Statistics, Consumer Expenditures in 2025 (Oct. 29, 2026) and detail table for all consumer units
- U.S. Bureau of Labor Statistics, CPI-U index data (public API), October 2024 to October 2026
- CBS News, Mary Cunningham, October CPI report (Nov. 10, 2026)
- Fox Business, Eric Revell, Consumer inflation rises faster than expected in October, CPI report shows (Nov. 10, 2026)
- Reuters, Ann Saphir, Fed's Waller plans to support at least a quarter-point rate hike in December (Nov. 10, 2026)
- Tipswatch, David Enna, Inflation moves higher in October, but annual numbers are missing (Nov. 10, 2026)