4.0°C Above Normal: Japan's El Niño Record Depends on Which Index You Read
Japan's gauge broke a 1997 record in September. NOAA's official measure, which strips out the warming of the whole tropical ocean, is still short of its 1983 high, and that gap shapes what this winter can expect.
For 28 years and nine months, the number to beat on Japan's El Niño gauge was +3.6°C, set in December 1997. It fell in September 2026. The Japan Meteorological Agency (JMA) said Friday, Oct. 9, that sea surface temperatures in its NINO.3 monitoring box averaged 4.0°C (7.2°F) above normal last month, measured against the agency's sliding 30-year baseline. That is the highest monthly value since records began in 1949, the agency said, and the figure appears in the Japan Meteorological Agency's monthly El Niño bulletin. The box itself is a strip of equatorial Pacific running east toward South America, from 5°N to 5°S and from 150°W to 90°W.
So is this the strongest El Niño ever recorded? On the raw thermometer readings, yes. Japan's figure is a record, and so is NOAA's traditional monthly Niño-3.4 index, measured against a 1991–2020 baseline. It reached +2.84°C in September, above the +2.72°C of November 2015. On the yardstick NOAA now uses to rank El Niño strength officially, the three-month Relative Oceanic Niño Index (RONI), it is not there yet.
RONI stood at +1.69°C for July through September, against a record +2.40°C set over December 1982 to February 1983. NOAA's Climate Prediction Center (CPC), which kept its El Niño Advisory in place on Thursday, Oct. 8, gives an 83% chance that October through December reaches +2.5°C or more, the level it calls a "historic event." In June, Daybreak Wire reported that NOAA had declared El Niño and put 63% odds on a "very strong" event; those odds look modest now. CPC's latest monthly Niño-3.4 reading, +2.1°C on its relative scale, already sits above +2.0°C. The three-month RONI that NOAA uses to grade strength (+1.69°C) has not caught up, though CPC's Sept. 17 outlook put the chance of a very strong event above 90%.
Both statements are true at once, and the gap between them is the real story. Japan's record is genuine, and NOAA's official gauge is likely to follow. But even JMA's own five-month running mean, the measure the agency uses to define an El Niño, sits at +2.6°C for May through September, against a record +3.4°C centred on November 1997. Single months can spike; the slower gauges still have ground to cover.
Here is where each agency's gauge stands, by Daybreak Wire's comparison of the agencies' published index data.
| Gauge (agency) | Latest | Previous record | Status |
|---|---|---|---|
| NINO.3 monthly, sliding 30-yr baseline (JMA) | +4.0°C, Sep 2026 | +3.6°C, Dec 1997 | Record |
| Niño-3.4 monthly, traditional 1991–2020 (NOAA) | +2.84°C, Sep 2026 | +2.72°C, Nov 2015 | Record (data from 1982) |
| Relative Niño3.4 weekly (BoM) | +2.72°C, week to Sep 27 | +2.76°C, week to Nov 22, 2015 | Second-highest (data from 2008) |
| ONI, traditional 3-month (NOAA) | +2.16°C, Jul–Sep 2026 | +2.59°C, Nov 2015–Jan 2016 | Not yet |
| Relative Niño-3.4 monthly (NOAA) | +2.08°C, Sep 2026 | +2.50°C, Jan 1983 | Not yet |
| RONI, relative 3-month, NOAA's official measure | +1.69°C, Jul–Sep 2026 | +2.40°C, Dec 1982–Feb 1983 | Not yet; NOAA gives 83% for Oct–Dec at +2.5°C or more |
| NINO.3 five-month mean, JMA's El Niño definition | +2.6°C, May–Sep 2026 | +3.4°C, centred Nov 1997 | Not yet |
None of this makes the event small. The NINO.3 box averaged 28.9°C at the surface in September, up from 24.5°C in October 2025. Beneath the eastern Pacific, CPC reported water more than 10°C above normal at depth. And the Atlantic produced no hurricane before October for the first time in the satellite era, according to NOAA's National Centers for Environmental Information (NCEI), in line with Daybreak Wire's July reporting on why a strengthening El Niño pointed to a quieter 2026 hurricane season.
How one ocean produces two different records
Every El Niño index is a subtraction. The question is what you subtract.
A traditional index asks how much warmer a patch of ocean is than its own 30-year average. A relative index asks how much warmer it is than the rest of the tropical ocean right now. Australia's Bureau of Meteorology (BoM), which switched to relative indices in September 2025, spells out the formula: the scaled difference between the Niño3.4 anomaly and the average sea surface anomaly across the tropics from 20°S to 20°N.
That subtraction matters this year because the whole tropical ocean is running hot. NCEI said the global ocean surface in September was further above normal than in any month on record, the fourth record month in a row. Part of the raw El Niño anomaly is simply that background warmth. Relative indices strip it out, and NOAA, which now sets its official strength thresholds on RONI, uses them because they track El Niño's grip on the atmosphere better.
"El Niño doesn't add new heat to the planet. It releases heat the ocean has already been storing beneath the surface … The ocean it's drawing from is the warmest we've ever measured it. There is simply more heat available to release."
Celeste Saulo, Secretary-General, World Meteorological Organization, at the Global Heat Forum in Bangkok
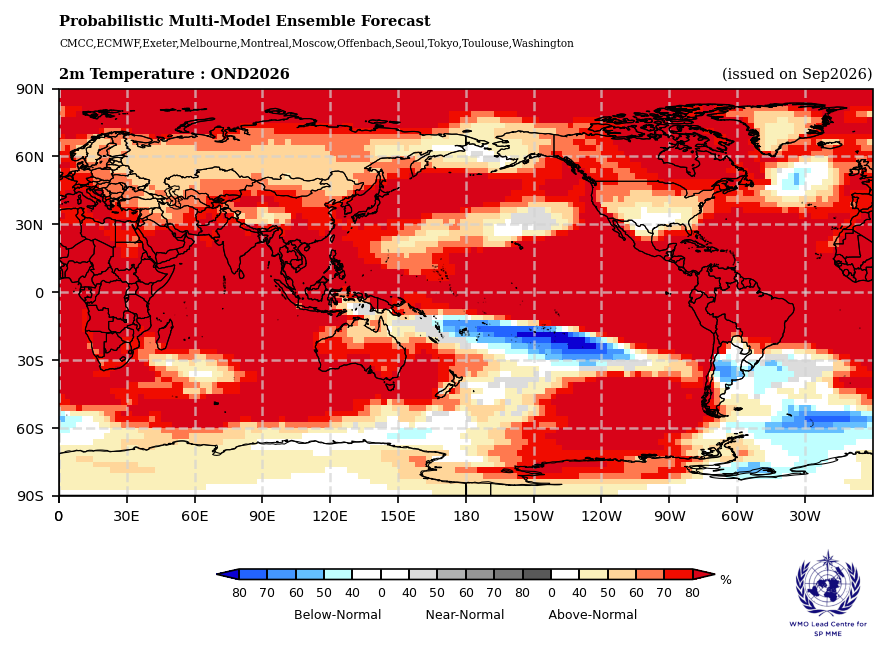
JMA's baseline slides forward, always the latest 30-year period, which partly absorbs long-term warming. Swap in a fixed 1991–2020 baseline and JMA's data still put September 2026 at +4.0°C, against +3.4°C for December 1997, so Japan's record holds either way. The World Meteorological Organization uses yet another scale: its consensus of 13 forecasting centres, working from a 1993–2009 baseline, expects the October–December Niño 3.4 average to reach about +3.7°C, peaking around December, against a previous record of +2.6°C. Different baselines, different numbers, same ocean.
NOAA's own framing on Oct. 8 was careful. The synopsis CPC posted called for a "strong-to-very strong" event, and NOAA's October ENSO discussion kept the word "historic" for a RONI of +2.5°C or more.
Post by @NWSCPC
The speed stands out too. Japan's gauge read −0.4°C in January, a 4.4°C swing in eight months. The 1997 record was set in December; this event passed it in September, three months earlier in the season, and JMA expects the reading to keep rising toward a Northern Hemisphere winter peak.
Which past event 2026 is chasing depends on the index you pick. On Japan's gauge, 1997–98 was the one to beat, and it is beaten. On NOAA's traditional ONI, the leader is 2015–16. On NOAA's relative measures, the champion is 1982–83. A headline that says "strongest ever" without naming the gauge tells you less than it seems.
Does a record El Niño mean a record winter?
Not automatically, and the reason is the same one that splits the indices.
"An important detail is that just because this El Niño is so powerful, that doesn’t necessarily mean we’re more confident about these impacts. The global warming of the oceans has made some of the historical mid-latitude impacts less likely, so there’s a kind of twist there."
Nathan Lenssen, climate scientist, National Center for Atmospheric Research
For the United States, CPC's 90-day outlook issued Sept. 17 laid out what it called "a classic El Niño signature" for November through April. Warmer-than-normal odds are favoured west of the Rockies and across the northern and central US, peaking at 50% to 60% over the interior Northwest and northern tier. Wetter-than-normal odds stretch across the southern and central US and up the Atlantic coast into New England, reaching 70% to 80% over southern Georgia and northern Florida. In plain terms: a milder North, a soggier South.
Here is the twist this year. The "Big Three" El Niños since 1950 (1982–83, 1997–98 and 2015–16, three of the bars in the chart above) all arrived with a positive Pacific Decadal Oscillation (PDO), a slow-moving pattern of North Pacific sea temperatures that tends to reinforce El Niño's effects. This time the PDO is negative, with an August index of −1.11, and CPC said that could dampen the usual impacts of a strong El Niño in some areas. The warm Gulf of Alaska waters that usually accompany a strong event are also shifted west, which may let slightly cooler water influence parts of the West Coast.
NOAA public affairs meteorologist Erica Grow Cei told weather.com that impacts generally spread across the US from December through March, and that daily and weekly sea-surface swings are not tied to them. So watch the seasonal picture, including NOAA's U.S. Winter Outlook due Thursday, Oct. 15, and your local National Weather Service office, not the day-to-day ocean readings.
In Britain, where the "Godzilla" nickname has done most of its work in headlines, forecasters are calmer. The Met Office's assessment is that El Niño raises the chances of a wetter, stormier autumn and early winter in northwest Europe. A Met Office spokesperson, quoted by the Evening Standard, said a weaker stratospheric polar vortex late in the winter can increase the potential for cold weather. Chief forecaster Will Lang called it a subtle shift in the odds
rather than a certainty. The Met Office saw "no indication" of widespread low-level snow in the coming weeks. (The WMO, for its part, says "super El Niño" is not part of its classification at all.)
Tim Stockdale, principal scientist at the European Centre for Medium-Range Weather Forecasts, told the Evening Standard there is "an expectation of the first part of the winter being milder, wetter and windier," and noted that the rain could help southern England's water levels after this year's drought. On the back half of the season he was blunt.
"Where the balance of things will be in later winter, I don’t feel confident about it."
Tim Stockdale, principal scientist, European Centre for Medium-Range Weather Forecasts
That is the honest reading for the UK: a nudge toward a wet, windy start and a tilt of the dice later on. BoM makes the same point for Australia, warning that a strong signal in the Niño3.4 region does not necessarily mean strong impacts on rainfall and temperature.
The bigger record may come in 2027
Where the absolute heat does matter is the global thermometer. NCEI said Friday that September 2026 was the second-warmest September on record, 1.33°C above the 20th-century average and 0.07°C behind 2023. January through September ranks second behind 2024, and NCEI expects 2026 most likely to finish second-warmest.
That is before El Niño has done its main work. The WMO says El Niño typically peaks between November and February and exerts its strongest influence on global temperature in the year after it begins. Bloomberg noted that record-hot years including 1998, 2010, 2016, 2023 and 2024 followed or accompanied major El Niños. The Met Office has already drawn the conclusion.
"Hence, 2027 is very likely to replace 2024 as the warmest year on record and be another year to temporarily exceed +1.5 C above the preindustrial period"
Nick Dunstone, Met Office
The costs are not waiting for 2027. Bloomberg reported that this El Niño has brought the weakest Indian monsoon in more than a decade and worsened wildfires in Indonesia, whose smoke has drifted over Singapore and Malaysia. Reuters photographed Panama Canal water levels falling on Sept. 4 for lack of rain.
The heat that is likely to make 2027 the warmest year on record is already sitting in the Pacific, counted on Japan's gauge. The record that would steer this winter's storm tracks, the one measured against an ocean that is itself the warmest on record, has not been set yet.


