Bay Area Waves Flood Pacifica and Set November Records at Three Buoys
Pacifica flooded and waves damaged Capitola's wharf railing as three NOAA buoys logged their biggest November seas on record. Forecasters expect a stronger storm by Wednesday.
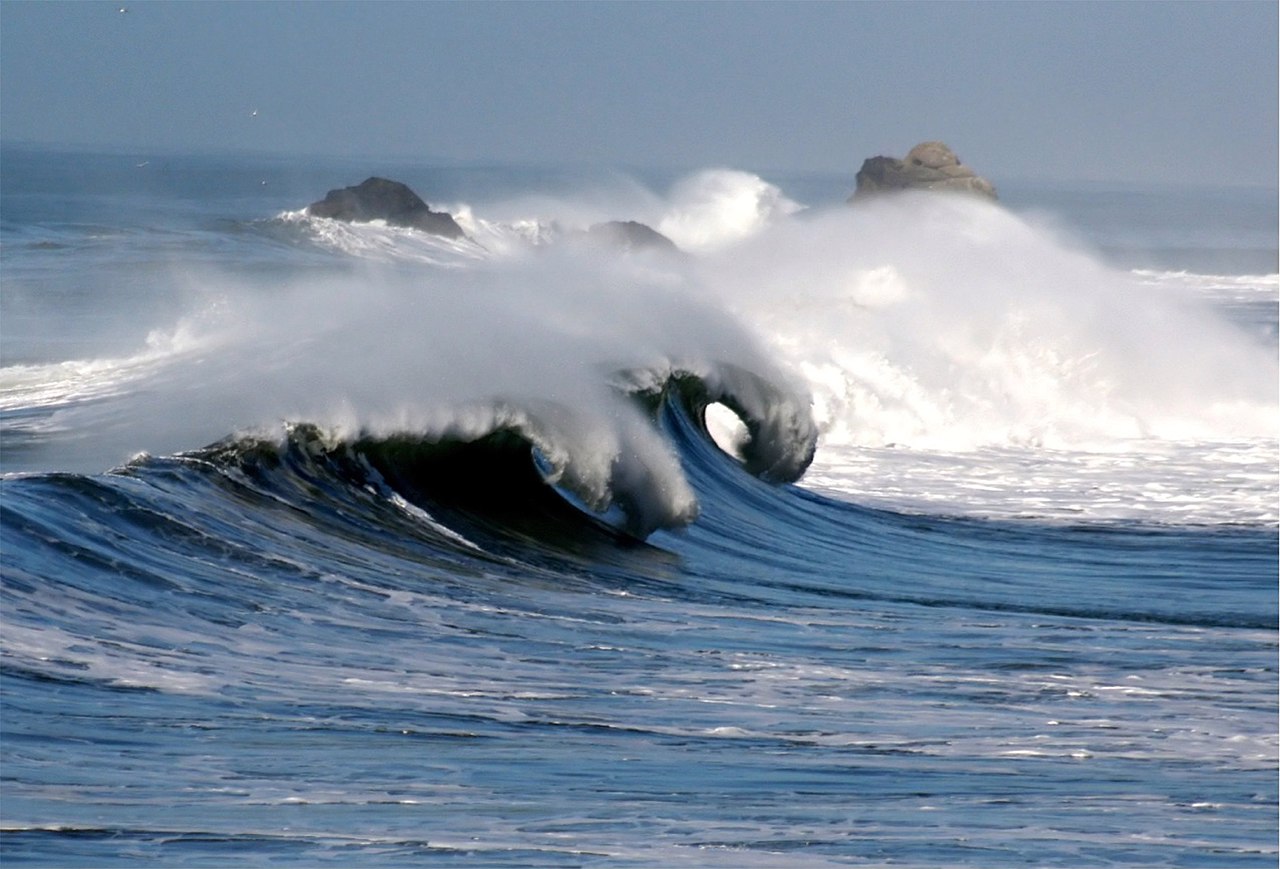
The ocean poured over Pacifica's seawall and across Highway 1 on Saturday, Nov. 14, driven largely by swell from a hurricane-force northeast Pacific storm, the National Weather Service said.
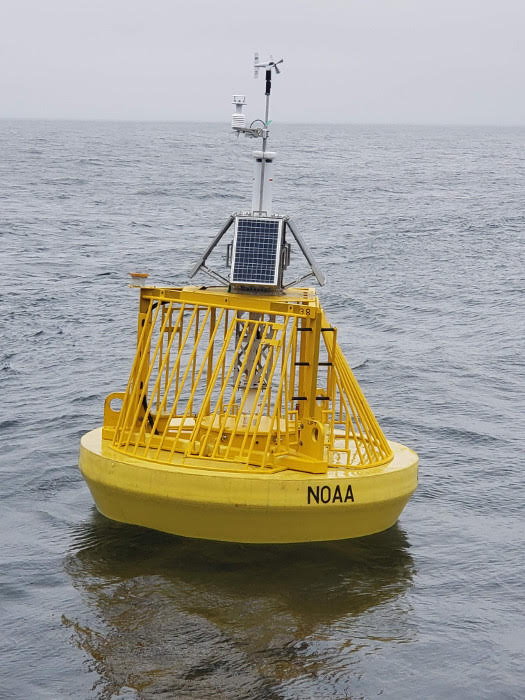
The weather service had a High Surf Warning out for every Pacific beach from Point Reyes to Big Sur. Santa Cruz County issued an evacuation warning, waves damaged the Capitola Wharf railing and Monterey County closed Scenic Road at Carmel Point. Offshore, NOAA's Monterey buoy logged a 10.0-meter (32.8-ft) sea, second only to January 2017 in its records.
That reading and the day's peaks at Point Reyes and Bodega Bay are the biggest November seas in those three buoys' archived records, though Monterey's archive has recent gaps. A weaker swell is forecast to linger until 4 a.m. Tuesday, and forecasters expect a stronger storm by Wednesday.
Marc Ramos, who surfs at Rockaway Beach in Pacifica at least twice a week, told the San Francisco Chronicle how the calendar felt from the water: I've seen it like this, but in mid-January. This is kind of odd. We haven't even hit Thanksgiving yet.
He has the story right. Saturday's Bay Area waves were not the biggest ever measured off California, because January 2017, January 2008 and the December 2015 El Niño swell still top them at the offshore buoys. What sets this swell apart is the date, and an ocean running about 10°F warmer than normal for mid-November.
Daybreak Wire compared Saturday's provisional NOAA readings with every archived reading from five Bay Area and Central Coast buoys, the oldest dating to the early 1980s. By height, Saturday sits near the top but not at it. By date, three buoys had never recorded anything like it in November in their archived data.
| NOAA buoy | Saturday's peak | Buoy record (date) | Saturday's rank | Previous November high |
|---|---|---|---|---|
| Monterey (46042) | 10.0 m (32.8 ft) | 10.42 m (Jan. 21, 2017) | 2nd | 8.92 m (2002) |
| Point Reyes (46214) | 9.5 m (31.2 ft) | 9.85 m (Dec. 10, 2015) | 2nd | 7.93 m (2019) |
| Bodega Bay (46013) | 9.4 m (30.8 ft) | 9.74 m (Jan. 5, 2008) | 3rd | 9.11 m (2002) |
| San Francisco (46026) | 7.0 m (23.0 ft) | 8.60 m (Jan. 5, 2008) | about 11th | 7.26 m (2001) |
The standout is the Monterey buoy, station 46042, moored 27 nautical miles off Monterey. Its 7:10 a.m. reading on Saturday trails only Jan. 21, 2017, nearly a decade ago.
In plain terms, the bigger waves in that sea averaged taller than a three-story building.
It beat the buoy's previous November high, set on Nov. 8, 2002, by 1.08 m (3.5 ft).
One caveat: the buoy has no archived data for 2024 through March 2026, so the ranking covers the years it was reporting.
Point Reyes peaked at what the Chronicle called the second-largest reading in three decades of records. By NOAA's numbers it fell about 1.1 feet short of December 2015. Scripps Institution of Oceanography put the timing in context:
"Typically, the largest waves arrive in December and January, and only one time in the 27-year record of the Point Reyes buoy have forecast wave heights been this large in November."
Scripps Institution of Oceanography, in a social media post quoted by the San Francisco Chronicle
Whether these were the biggest waves in a decade depends on where you measure. At the San Francisco buoy, offshore of the city, January 2023 and January 2017 were both bigger.
Thirty-two feet, or sixty?
A buoy reading and a wave at Mavericks are not the same measurement.
The National Data Buoy Center defines significant wave height as the average of the highest one-third of waves in each sampling period. By design, plenty of waves are taller than that, and maximum waves are often 1.8 times bigger, the Chronicle reported.
Period matters too. Early Saturday the most energetic waves reached the Monterey buoy 21 seconds apart, a sign of long, powerful swell. Height compounds it: "a 40-foot wave slams into the coast with four times as much energy as a 20-foot wave," the Chronicle wrote.
When that long, heavy swell reaches a shallow reef or harbor bar, it slows and stands up, which the weather service called "wave enhancement near harbor entrances and bars due to shoaling." That is how a 30-ft sea becomes the warning's "occasional sets of 40 to 50 ft at favored breakpoints."
The 60-ft figure came from the weather service's Bay Area account on X, which applied it to "fully exposed beaches," not to the coast as a whole.
Post by @NWSBayArea
On land, reach matters as much as height. Wave run-up raises the mean water level by 10-20% of the breaking wave height on exposed beaches, the weather service wrote, letting waves crash over seawalls, "particularly during high tide."
That is what Pacifica got. Every 30 minutes or so, a wave that looked double the size of the last pushed water hundreds of feet inland, the Chronicle reported.
Rocks, kelp and debris ringed the Taco Bell Cantina, and nearly a foot of floodwater on Highway 1 kept cars out of its lot. Near the Pacifica Pier, a sneaker wave knocked down spectators, including a mother carrying a toddler, in front of the City Council Chambers; bystanders helped both up.
On Elder Lane, homeowner Adam Drake told the Chronicle only 2023 brought worse flooding. Recently installed pumps at the end of the road were not draining the water, the paper reported.
In Capitola, video shared with KSBW shows waves damaging the wharf railing around 12:30 p.m., near high tide. The wharf had reopened in September 2024 after a $10.6 million rebuild.
Santa Cruz closed its beaches and wharf from 10 p.m. Friday to 5 a.m. Sunday. The city had cause for caution: on Dec. 23, 2024, the end of the Santa Cruz Wharf partially collapsed, sending three employees into the water, SFGATE reported.
At Carmel Point, waves left large rocks and sand across Scenic Road, and KSBW said the road is expected to stay closed through Tuesday.
What El Niño does, and doesn't
El Niño is the obvious suspect, and the evidence supports a narrower charge.
NOAA's Climate Prediction Center said on Nov. 12 that a strong-to-very strong El Niño is likely through January-March 2027, and said the chances of El Niño-like impacts are "higher, though not guaranteed." (Our look at the record El Niño numbers compares this year's index readings.)
The mechanism runs through the storm track. "During El Niño, storms also tend to track farther south, forming closer to California and increasing wave activity along the coast," Scripps wrote, and the Chronicle reported that wave power along the coast is 32% stronger in strong El Niño years.
But a shifted average does not cause one storm. SFGATE reported that Saturday's waves are not directly connected to El Niño, though it could make the effects worse.
Meredith Albert, emergency services manager for the city of Santa Cruz, told SFGATE that "El Niño is the headline," while noting that some of the city's worst flooding, including the 2024 wharf collapse, came in non-El Niño years. She called it "just turning up the volume on the hazards that we already know we have."
The warm water, by contrast, is measured. At the Monterey buoy, the sea surface in the week ending Saturday averaged warmer than any single mid-November reading in its record.
| Sea-surface temperature, Monterey buoy (46042) | °F |
|---|---|
| Average, week ending Saturday, Nov. 14 | 67.3 |
| Mid-November average, 1987-2023 | 57.2 |
| Warmest mid-November reading, 1987-2023 | 62.2 |
That warmth shows an ocean already outside its November range in the same week the buoys set November wave records.
The last super El Niño shows what a full season can do. A U.S. Geological Survey study found that in the 2015-16 winter, central California beaches retreated by a mean of 45.7 m (150 ft).
Ocean Beach alone lost 180 feet of sand, the Standard reported.
Wednesday's storm
The weather service's high surf advisory runs until 4 a.m. Tuesday, Nov. 17. It calls for breaking waves up to 25 ft, with occasional sets up to 35 ft at favored breakpoints.
The weather service's forecast discussion put it plainly: "Do not go in the water, avoid climbing on the rocks or leaning over seawalls, and never turn your back on the ocean."
The next system arrives late Tuesday and could last into early Friday, and the weather service wrote that it "is looking to be more impactful than the previous two."
Wave heights are forecast to peak around 25 feet Wednesday evening, according to the ECMWF model, the Chronicle reported. A slightly more westerly and southerly direction could put Santa Cruz more squarely in the path.
Pressure off Northern California Wednesday night is forecast near record lows for November, and sea levels could run 2 to 2.5 feet above tide-chart predictions, the paper reported. It said lunar cycles will bring much higher water Thanksgiving week, the season of king tides.
"The initial swell is on the downtrend right now, but we are expecting to get a couple more northwesterly swells this week because the Pacific is so active right now," Rachel Kennedy, a National Weather Service meteorologist, told SFGATE.
The Monterey buoy, riding far offshore in a sea that already feels like January, should register Wednesday's forecast swell before anyone on shore sees it, and the Climate Prediction Center's next El Niño update lands Dec. 10.


